As most people that have been in a hospital setting or have had any heart problems know, an EKG is the medical device that records the electrical activity of the heart. I have chosen to discuss the EKG in detail because in later blogs, there will be terms used concerning the waves found on a patient's EKG. Usually if a doctor hears a heart murmur, sees something he or she is curious about or the patient has been complaining of chest pain, the doctor will order an EKG. The EKG is capable of discovering arrhythmias, myocardial infarctions (heart attacks), atrial enlargement, ventricular hypertrophies, and bundle branch blocks.
Normally, there is a conduction pathway in which the electrical activity of the heart follows. Keep in mind that the action potentials in the cells (remember the sodium and potassium channels and depolarization/repolarization stuff?) that control muscle contraction follow the same pattern in the heart. Contractions in the heart are also caused by electrical action potentials. The normal conduction pathway in the heart is as follows:
1. Located at the top of the right atrium is the Sinoatrial Node (SA Node), which is commonly called the pacemaker of the heart. This is appropriate because this is the node that sets the rhythm of the heartbeat. While all of the heart's cells are capable of generating electrical impulses that trigger contraction, the SA nod controls the pace because it generates impulses slightly faster than the rest of the heart. The intrinsic rate of the Sinoatrial Node is about 60-100 beats per minute.
2. The Atrioventricular Node (AV Node) is conveniently located between the right atrium and the right ventricle within the atril septum. If the SA node fails to set the heart rhythm correctly, the AV node picks up the slack and is the secondary pacemaker. The AV node's normal intrinsic firing rate without stimulation from the SA node is 40-60 beats per minute.
3. The Bundle of His receives the stimulation from the AV node to the point of the apex of the fascicular branches, which lead to the Purkinje Fibers that innervate the ventricles. The intrinsic rate of the Bundle of His is between 40-60 beats per minute when there is no stimulation from the SA and AV node.
4. Located in the inner ventricular walls of the heart, the Purkinje fibers are the next step in the conduction pathway. During the ventricular contraction of the cardiac cycle, they carry the contraction impulse from the left and right bundle branch to the ventricles. Purkinje fibers are also capable of acting as the pacemaker but are not specifically designed for this purpose due to their generation of action potentials at lower frequencies than the SA or AV nodes. This serves as the last resort when the other pacemakers listed above fail.
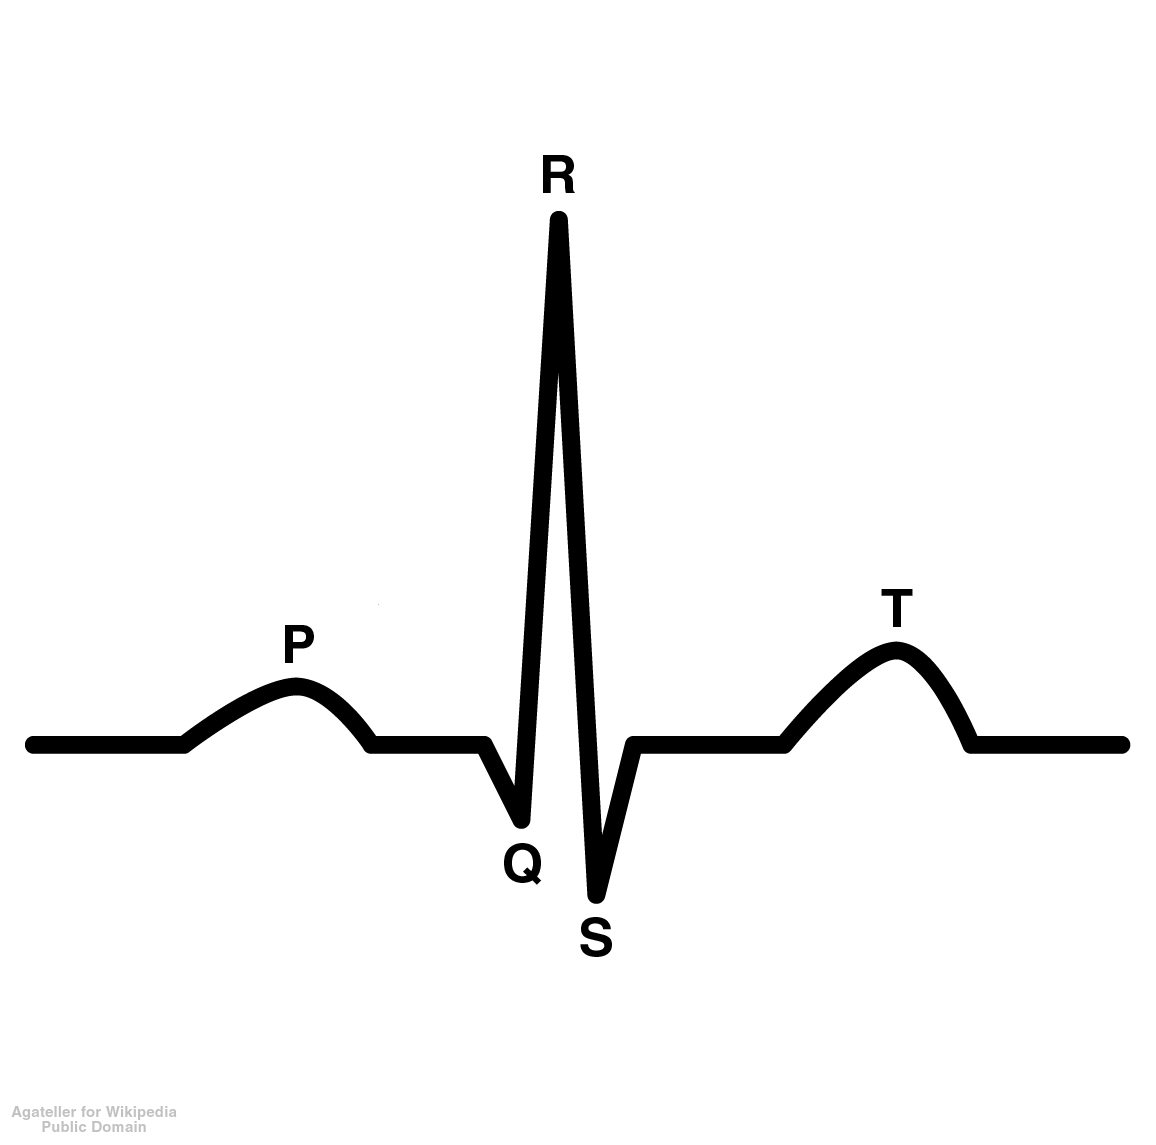
Now that we know the basics of the conduction pathway, let's talk about the actual EKG printout. Just what are all of those lines? Here is a picture of one with the different letters assigned to it:
P Wave=represents the depolarization of the atria (the beginning of the action potential when the cells become more positive, or less negative)
PR Interval=Represents the atria to ventricular conduction time (from the SA node to the AV node). This is measured from the onset of the P wave to the onset of the QRS complex and should last about 0.12-2.00 seconds.
QRS Complex=The QRS complex represents the depolarization of he right and left ventricles, which is coordinated by the Bundle of His and the Purkinje Fibers. A Q wave is a downward deflection after the P wave. An R wave is an upward reflection and the S wave is a downward deflection after the R wave. There may be multiple variations of this wave. The Q downstroke may not be present at all and the R upward deflection will show first or there may be an upward deflection after the S wave denoted R' which is representative of a bundle branch block. the duration, amplitude and morphology of the QRS complex is key to diagnosing cardiac arrhythmias, conduction abnormalities, ventricular hypertrophies, myocardial infarction or electrolyte derangements.
ST Segment=This serves as the isoelectric line from which to measure the amplitudes of the other waveforms. This is very important diagnostically for physicians because they can determine if the person has had a myocardial infarction (heart attack) by an elevation in this wave or ischemia, which is seen as a depression in the wave. ST elevation may indicate myocardial infarction (heart attack).
QT Interval=This represents the duration of activation and recovery of the ventricular muscle, which varies inversely with the heart rate. Thus the faster the heart rate, the shorter the QT interval. This QT interval does vary, the new QT Interval is called the corrected QT interval. This tends to be slightly longer for females and increases with age. A prolonged QT interval is a risk factor for ventricular tachyarrhythmias and sudden death.
T Wave=This represents ventricular repolarization. This is often times referred to as the refractory time for the heart, which is when the heart does not react to an action potential. The T-wave inversion (negative T waves the dip down instead of up) can be a sign of coronary ischemia, left ventricular hypertrophy or other disorders. There are other signs concerning the T wave that may lead to other diagnoses as well.
While one may still look at an EKG and not understand how to tell if one is normal or not, do not be alarmed! That's what the physician's job is! In basic terms, the EKG is printed out on boxes that have been scrutinizingly studied mathematically to determine what the normal height and width of certain waves should be. The height and width declares the amount of time in which a person is at a certain stage of their cardiac rhythm and this is how they make the correct diagnosis. But clearly this is one of the most powerful tools available to those that have heart problems and need a fast diagnosis.

No comments:
Post a Comment